Every Jira team has a version of this story.
The sprint ends. The retrospective starts. Someone pulls up the board and says, “I think we were blocked on that issue for like two weeks?” Someone else says, “Was that the same sprint we had the risk discussion?” Nobody really knows. The conversation goes in circles for 45 minutes, producing a list of vague action items that nobody follows up on.
Sound familiar?
The problem isn’t your team. It’s that Jira out of the box tracks what you’re doing — but it doesn’t help you understand why things go wrong, how healthy your process actually is, or what’s worth working on next. Those gaps lead to recurring retrospective pain, missed risks, and sprints that feel productive but deliver less than they should.
Here are five of the most common pain points we hear from Jira teams — and the tools that fix them.
Pain Point #1: “We don’t know where issues get stuck — until it’s too late”
The story:
Elena is a delivery lead at a 40-person software company. Her team uses Jira, has well-defined statuses, and runs two-week sprints. But every sprint review, at least two or three issues come up that were sitting in “In Review” or “Waiting for QA” for days — sometimes the entire sprint — without anyone noticing.
The issues weren’t forgotten. They just weren’t visible as problems until the sprint ended and she started counting days manually in the activity log. By then, the sprint was over.
The real problem:
Jira shows you the current status of an issue. It doesn’t show you how long it’s been sitting there, who moved it last, or whether the time spent in each status is normal or a red flag. You only see the history if you open every issue individually and scroll through the activity feed — which nobody does in time.
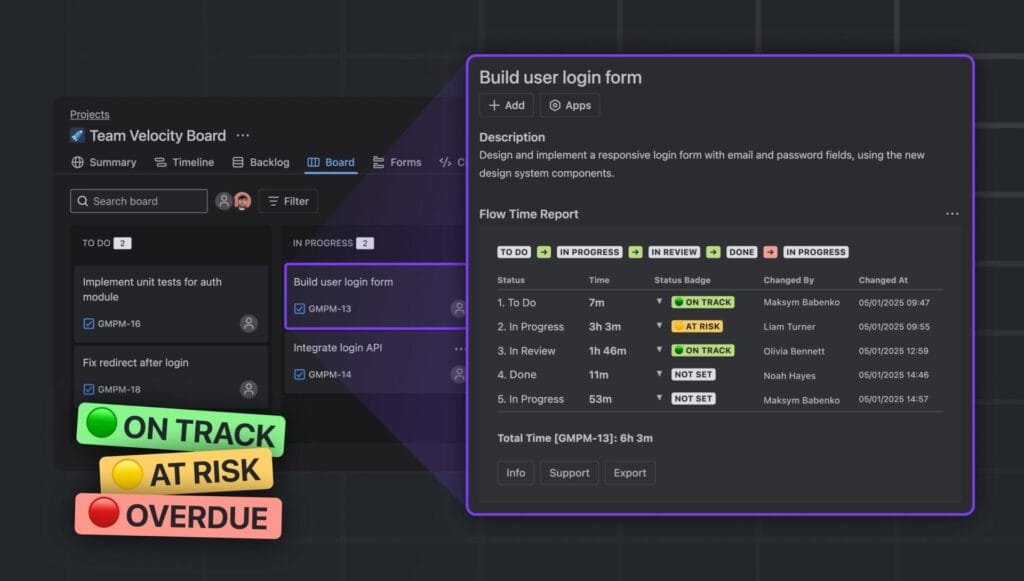
The fix: Flow Time Report – Time in Status for Jira Issues
Flow Time Report tracks the complete transition history of every issue — how long it spent in each status, who changed each status and when, and whether the issue’s health should be flagged as at risk.
You can see at a glance which issues have been in “In Review” for 6 days, which ones were moved backward in the workflow (and by whom), and where your bottlenecks consistently appear across sprints. Instead of discovering problems at the retrospective, Elena’s team now catches stalled issues mid-sprint — and the post-sprint data tells them exactly where to focus process improvement.
Best for: Scrum teams, Kanban teams, delivery leads, engineering managers, anyone running retrospectives and wanting data instead of guesses.
Pain Point #2: “Risks get discussed in Slack and forgotten in Jira”
The story:
David manages a platform team building integrations for enterprise clients. Risk discussions happen — in Slack threads, in planning meetings, in comments on tickets. Everyone agrees “this is risky.” But none of that ever makes it into Jira in a structured way.
Six weeks later, one of those risks materializes into an incident. David goes back to find the original issue. There’s a comment somewhere in the thread that says “⚠️ this could be a problem if X happens.” It was never tracked, never escalated, never prioritized against other risks.
The real problem:
Risk is contextual — it belongs on the issue itself, not in a separate risk register that nobody opens. But Jira has no native risk field. So risk lives in comments, in meetings, and in people’s heads — until it becomes a crisis.
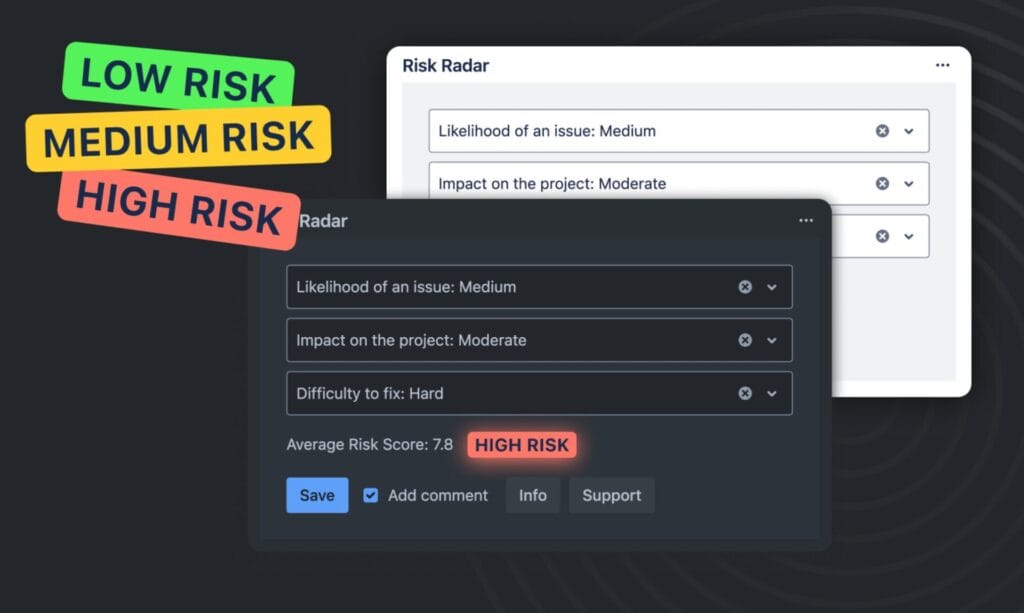
The fix: Risk Radar for Jira – Risk Management, Assess & Track
Risk Radar adds structured risk assessment directly to Jira issues. You evaluate three dimensions — Likelihood, Impact, and Complexity to Fix — and the app calculates an automatic risk score. Issues are classified as Low, Medium, or High risk, so your team can see at a glance which issues carry the most risk before they start the sprint.
No separate risk register. No context-switching. The risk data lives where the work lives.
For David’s team, the shift was immediate: risk assessment became part of issue creation, not an afterthought. Now when something goes wrong, there’s a clear record of whether the risk was known, assessed, and accepted — or whether it fell through the cracks.
Best for: Platform teams, integration projects, teams delivering to enterprise clients, any team where risk needs to be traceable and auditable.
Pain Point #3: “We feel productive every sprint, but our velocity chart tells a different story”
The story:
The team at a fintech startup completes most of their sprint goals. Every retro, the mood is positive. But the CTO keeps asking why the roadmap slips by two weeks every quarter. Nobody can explain it clearly.
When they finally dig into the data, the pattern is obvious: scope creep mid-sprint, a few high-story-point issues consistently carrying over, and velocity that looks stable on paper but hides a lot of churn underneath.
The real problem:
Jira’s built-in burndown chart shows you whether you’re on track — but it doesn’t explain why you’re off track. Scope changes, issue carryover, blocked work, and team capacity shifts are all collapsed into a single line. You can see the outcome, but not the causes.
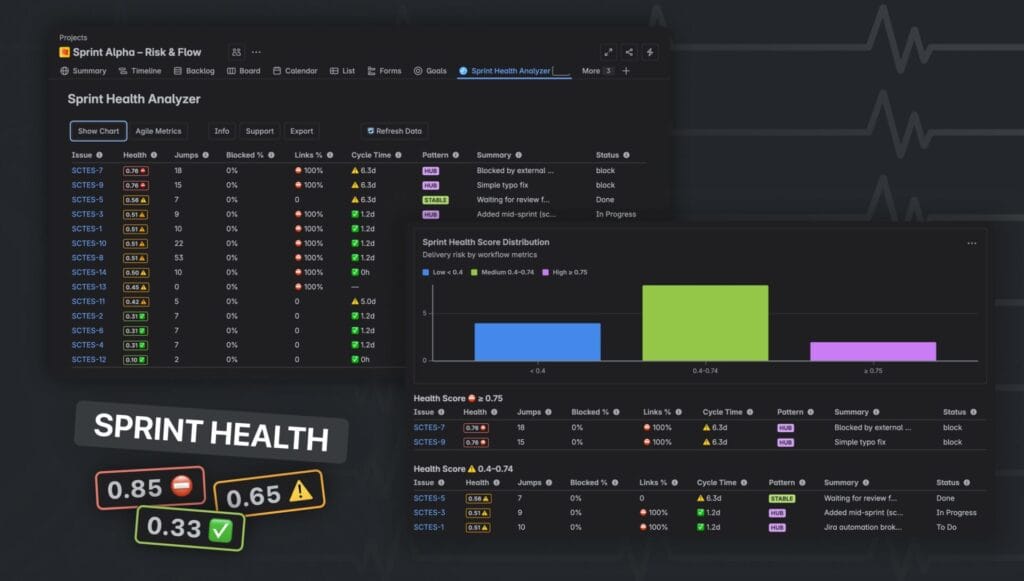
The fix: Sprint Health Analyzer – Velocity, Burndown, Burnup for Jira
Sprint Health Analyzer gives you the full picture of sprint health in one view: Velocity chart, Burndown, and Burnup — plus a health score that factors in scope changes, blockers, and delivery risk. You can see not just whether stories were completed, but how cleanly the sprint ran.
The CTO got the answer within the first sprint of using it: scope was being added to active sprints at a rate that wiped out the equivalent of three story points every iteration. The burndown looked fine. The burnup showed the problem.
Best for: Scrum teams, engineering managers, CTOs and VPs tracking delivery predictability, Agile coaches running sprint health reviews.
Pain Point #4: “We’re guessing what to build next”
The story:
Sophie is a product manager at a B2B SaaS company. Her backlog has 200+ items. Stakeholders from sales, customer success, and engineering all push for their own priorities. Every grooming session turns into a negotiation.
She’s heard of WSJF. She’s read about RICE scoring. She built a spreadsheet once — it lasted two weeks before it was out of date. Now prioritization is back to whoever argued loudest in the last meeting.
The real problem:
Prioritization frameworks are only useful if they’re embedded in the actual workflow. Spreadsheets die. Documents get stale. If scoring doesn’t happen inside Jira — where the issues live — it doesn’t happen consistently.
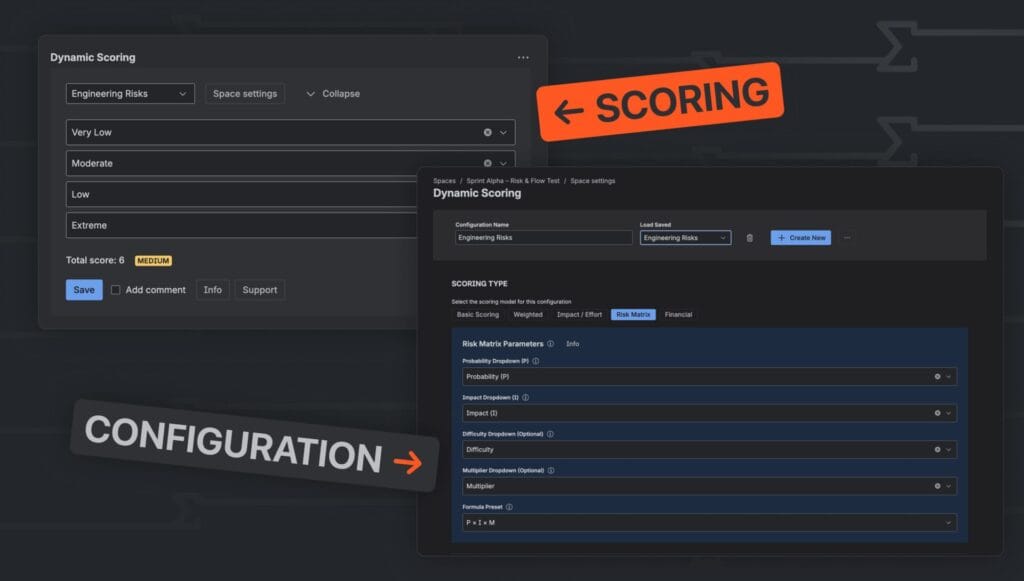
The fix: Dynamic Scoring for Jira – Custom Score & Agile Evaluation
Dynamic Scoring lets you build any scoring model — WSJF, RICE, ICE, ROI, or your own custom formula — directly inside Jira issues. You define the fields, the weights, and the formula. Scores are calculated automatically and are visible on every issue.
Sophie built a WSJF model in under 20 minutes. Now every issue in the backlog has a score. Grooming sessions have a shared reference point. The argument shifted from “I think this is important” to “here’s why this scores higher than that.” Stakeholder conversations got shorter and more productive.
Best for: Product managers, product owners, anyone managing a backlog with competing stakeholder priorities, teams using SAFe, LeSS, or any framework that involves explicit prioritization.
Pain Point #5: “We can’t see where our delivery process actually breaks down”
The story:
Marcus runs engineering at a mid-sized company. His team delivers features on a regular cadence — or so it seems. But customer-reported issues keep surfacing long after features are “done.” The QA phase feels rushed. Engineers say they don’t have enough time for code review. Nobody can quite explain why.
He starts looking at the data. Stories go from “In Progress” to “Done” in what looks like a reasonable time. But when you break it down — how long did the issue spend actively being worked on versus sitting in a queue versus blocked — the picture is completely different. Most of the “time in development” is actually time waiting.
The real problem:
Delivery metrics that show only start-to-finish time are misleading. The meaningful question is: of the total time an issue was open, how much was active work versus waiting versus blocked? Without that breakdown, you’re optimizing the wrong things.
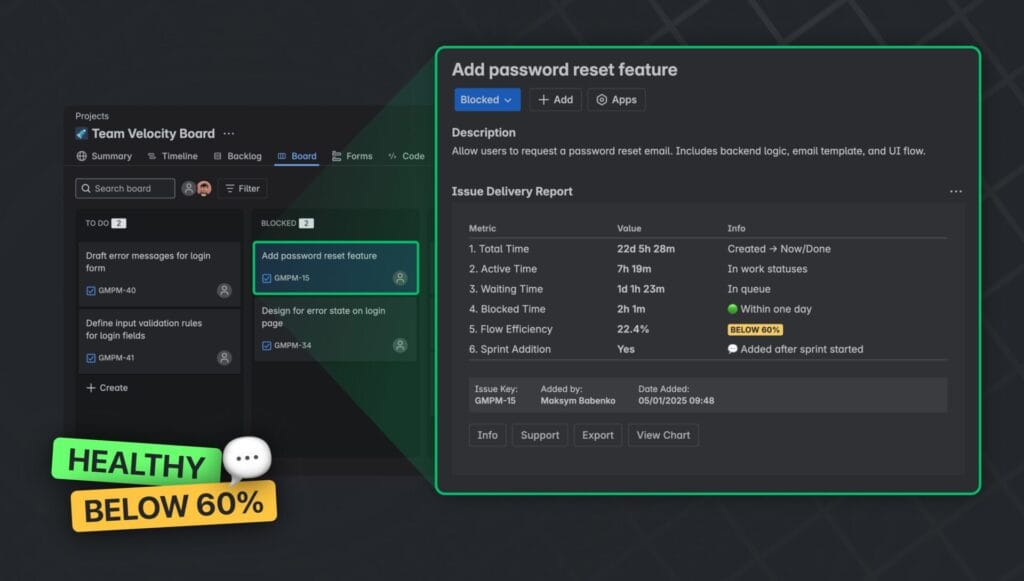
The fix: Issue Delivery Report – Issue History and Charts for Jira
Issue Delivery Report analyzes the transition history of Jira issues and categorizes time into three phases: Active, Waiting, and Blocked. You can see immediately where your workflow has structural bottlenecks — not just which issues were slow, but why they were slow and at what stage.
For Marcus, the data was unambiguous: 60% of the average issue’s lifetime was spent in “Waiting for Review” — not because engineers were slow, but because reviews were being batched and delayed. A simple process change (no issue sits in review queue for more than 24 hours) cut delivery time by a third within two sprints.
Best for: Engineering managers, Agile coaches, team leads doing flow analysis, any team that wants to move from velocity metrics to genuine flow efficiency.
One Team, Five Tools, One Common Thread
These five pain points look different on the surface. But they share the same root cause: Jira tracks your work, but doesn’t help you understand it.
The apps above — all five of them Cloud-native, all running on Atlassian’s own infrastructure — fill exactly that gap. They don’t require complex configuration or dedicated Jira admins. They’re designed to be useful within minutes of installation, for the people doing the work, not just for the people reporting on it.
| The pain | The fix |
|---|---|
| Issues getting stuck without anyone noticing | Flow Time Report |
| Risks discussed but never tracked | Risk Radar |
| Sprint health not visible until it’s too late | Sprint Health Analyzer |
| Backlog prioritization based on opinion, not data | Dynamic Scoring |
| Delivery process bottlenecks invisible in the data | Issue Delivery Report |
All five are available on the Atlassian Marketplace with a free trial. If any of the stories above sound like your team — that’s probably where to start.
Built by TypeSwitch — Jira Cloud apps for teams that care about delivery. All apps run on Atlassian infrastructure. See all apps →
Read More
[{"id":4524,"link":"https:\/\/typeswitch.net\/blog\/best-language-switcher-macos\/","name":"best-language-switcher-macos","thumbnail":{"url":"https:\/\/typeswitch.net\/wp-content\/uploads\/2024\/11\/Type-Switch-Personalize-Your-Button.png","alt":"Minimalist design of Type Switch app for language changes on macOS."},"title":"Best Language Switcher for macOS in 2026: Type Switch for Multilingual Typing","postMeta":[],"author":{"name":"Babenko Maksym","link":"https:\/\/typeswitch.net\/blog\/author\/max-babenko\/"},"date":"\u0422\u0440\u0430 17, 2026","dateGMT":"2026-05-17 13:47:43","modifiedDate":"2026-05-17 13:56:53","modifiedDateGMT":"2026-05-17 13:56:53","commentCount":"0","commentStatus":"closed","categories":{"coma":"<a href=\"https:\/\/typeswitch.net\/blog\/category\/uncategorized\/\" rel=\"category tag\">Uncategorized<\/a>","space":"<a href=\"https:\/\/typeswitch.net\/blog\/category\/uncategorized\/\" rel=\"category tag\">Uncategorized<\/a>"},"taxonomies":{"post_tag":""},"readTime":{"min":7,"sec":17},"status":"publish","content":"Working with multiple languages on your Mac should feel natural. But for many people, switching keyboard languages is still one"},{"id":4510,"link":"https:\/\/typeswitch.net\/blog\/best-developer-tools-macos-2026\/","name":"best-developer-tools-macos-2026","thumbnail":{"url":"https:\/\/typeswitch.net\/wp-content\/uploads\/2026\/05\/Preview_1_en.jpg","alt":""},"title":"Best Developer Tools for macOS in 2026: Essential Mac Apps for Coding","postMeta":[],"author":{"name":"Babenko Maksym","link":"https:\/\/typeswitch.net\/blog\/author\/max-babenko\/"},"date":"\u0422\u0440\u0430 17, 2026","dateGMT":"2026-05-17 07:32:59","modifiedDate":"2026-05-17 07:46:13","modifiedDateGMT":"2026-05-17 07:46:13","commentCount":"0","commentStatus":"closed","categories":{"coma":"<a href=\"https:\/\/typeswitch.net\/blog\/category\/uncategorized\/\" rel=\"category tag\">Uncategorized<\/a>","space":"<a href=\"https:\/\/typeswitch.net\/blog\/category\/uncategorized\/\" rel=\"category tag\">Uncategorized<\/a>"},"taxonomies":{"post_tag":""},"readTime":{"min":9,"sec":1},"status":"publish","content":"macOS is still one of the best environments for developers in 2026. You get a Unix-based system, strong hardware, great"},{"id":4402,"link":"https:\/\/typeswitch.net\/blog\/confluence-public-links-alternative\/","name":"confluence-public-links-alternative","thumbnail":{"url":"https:\/\/typeswitch.net\/wp-content\/uploads\/2026\/05\/Confluence-public-links-alternative.png","alt":"Illustration showing Confluence pages published to the public web with Public Pages for Confluence"},"title":"Confluence Public Links Alternative: Publish Pages with SEO, Branding and Custom Domains","postMeta":[],"author":{"name":"Babenko Maksym","link":"https:\/\/typeswitch.net\/blog\/author\/max-babenko\/"},"date":"\u0422\u0440\u0430 8, 2026","dateGMT":"2026-05-08 16:02:11","modifiedDate":"2026-05-08 17:59:18","modifiedDateGMT":"2026-05-08 17:59:18","commentCount":"0","commentStatus":"closed","categories":{"coma":"<a href=\"https:\/\/typeswitch.net\/blog\/category\/atlassian\/\" rel=\"category tag\">Atlassian<\/a>","space":"<a href=\"https:\/\/typeswitch.net\/blog\/category\/atlassian\/\" rel=\"category tag\">Atlassian<\/a>"},"taxonomies":{"post_tag":""},"readTime":{"min":7,"sec":27},"status":"publish","content":"By Maksym Babenko \u00b7 ~5 min read \u00b7 May 8, 2026 Confluence public links are useful when you need to share a page"},{"id":4238,"link":"https:\/\/typeswitch.net\/blog\/how-to-set-up-seo-for-public-confluence-pages\/","name":"how-to-set-up-seo-for-public-confluence-pages","thumbnail":{"url":"https:\/\/typeswitch.net\/wp-content\/uploads\/2026\/04\/Confluence-SEO.png","alt":"SEO public Confluence pages"},"title":"How to Set Up SEO for Public Confluence Pages","postMeta":[],"author":{"name":"Babenko Maksym","link":"https:\/\/typeswitch.net\/blog\/author\/max-babenko\/"},"date":"\u041a\u0432\u0456 30, 2026","dateGMT":"2026-04-30 11:20:10","modifiedDate":"2026-05-08 18:25:43","modifiedDateGMT":"2026-05-08 18:25:43","commentCount":"0","commentStatus":"closed","categories":{"coma":"<a href=\"https:\/\/typeswitch.net\/blog\/category\/atlassian\/\" rel=\"category tag\">Atlassian<\/a>","space":"<a href=\"https:\/\/typeswitch.net\/blog\/category\/atlassian\/\" rel=\"category tag\">Atlassian<\/a>"},"taxonomies":{"post_tag":""},"readTime":{"min":7,"sec":27},"status":"publish","content":"By Maksym Babenko \u00b7 ~4 min read \u00b7 April 30, 2026 Publishing a Confluence page is only the first step."}]